Visualization and Storytelling Using Data
Why You Need Data Visualization in Your Professional Tool Kit
Data has the power to tell a compelling story, guide conversations, and influence decisions with profound consequences for swift business actions. Research shows that data-driven organizations are more likely to retain customers and be more profitable–but it’s your job to explain how the data supports your major points and to influence key decision-makers.
“As professionals working with data, we have the power to change minds and change the trajectory of business outcomes if we tell the right data stories.”
-Michelle S. Glaser, MPH
Director of Data Analytics Adjunct Professor, Columbia Engineering
Course Highlights

Live Fireside Chat with Faculty

Design Exercises

Peer Discussion Groups

Applicable to any software choice (Tool-Agnostic approach)

Final Capstone Project with Real-World Application

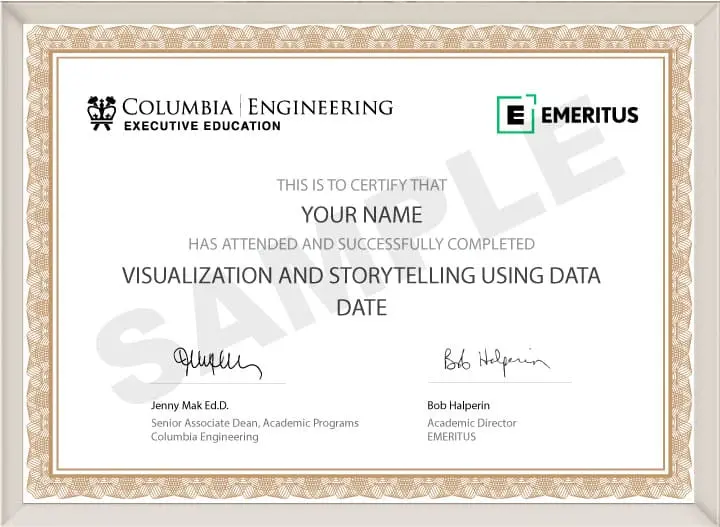
Certificate of Completion from Columbia Engineering
Learning Outcomes
Build a data story that is supported by a point of view and recommendation that is capable of driving business decisions and enhances career growth.
Communicate more clearly by selecting the right visual for your data.
Select and use appropriate charts for a variety of common data types
Implement design choices to ensure a clean visual appearance, clear messaging, and a coherent point of view
Implement design choices to include simple, yet informative text elements
Syllabus
This course is comprised of six weekly modules, offering a systematic approach for delivering applied design theory principles in a way that adds tremendous value to your role and your organization.
Faculty

Director of Data Analytics Adjunct Professor, Columbia Engineering
Michelle Glaser is an analytics leader who has built the analytics team and culture at multiple organizations. She is an epidemiologist-turned-analyst who has a passion for nu...

Certificate
Upon successful completion of the course, participants will receive a verified digital certificate from Emeritus in collaboration with Columbia Engineering Executive Education.
FAQs
Didn't find what you were looking for? Write to us at learner.success@emeritus.org or Schedule a call with one of our Program Advisors or call us at +1 315 840 3227 (US) / +44 203 838 0797 (UK) / +65 3129 4176 (SG)
Early registrations are encouraged. Seats fill up quickly!
Flexible payment options available.
Starts On
